Drop-One Ablation Study

Breast cancer decision tree. Which features matter? Scroll to explore.

✓ Best to Keep
-
When Kept
-
Average accuracy across all models that include this feature
When Dropped
-
Accuracy drops significantly without this feature
✗ Best to Drop
-
When Kept
-
Average accuracy when this feature is included
When Dropped
-
Performance improves without this feature
▼ Scroll down

Real-World Impact

What these numbers mean for actual patient predictions

Mammogram X-rays showing breast tissue analysis
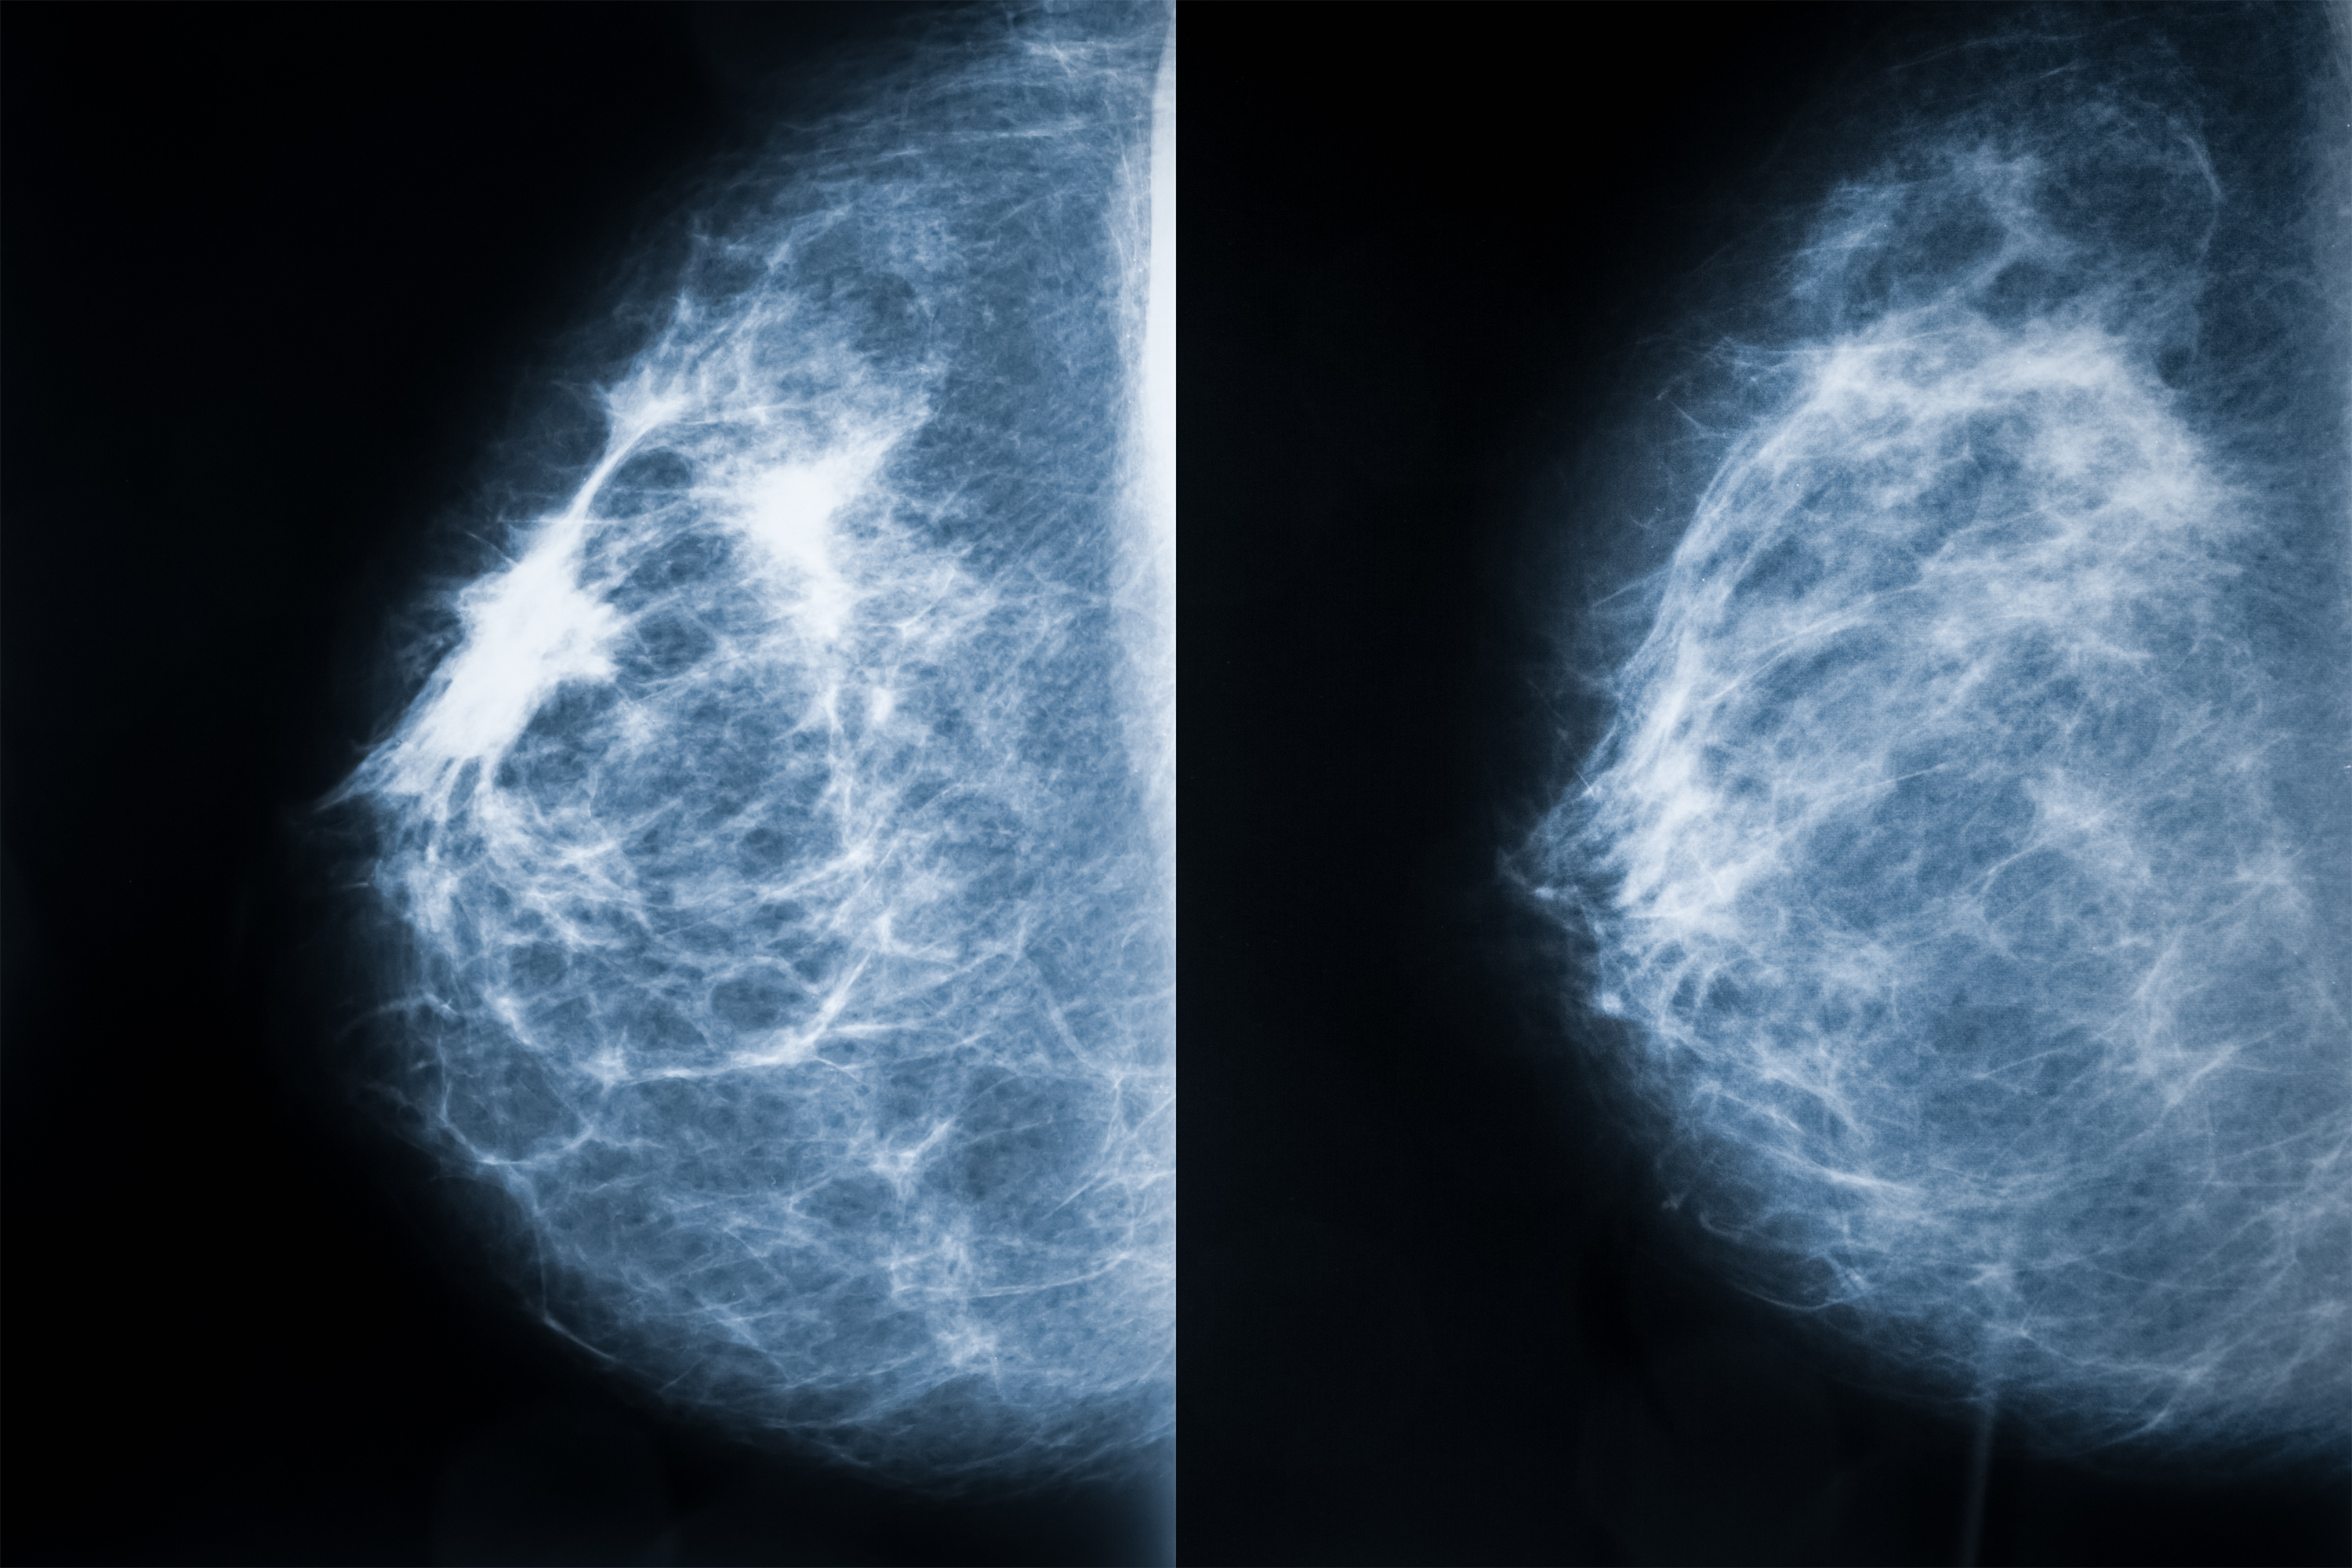
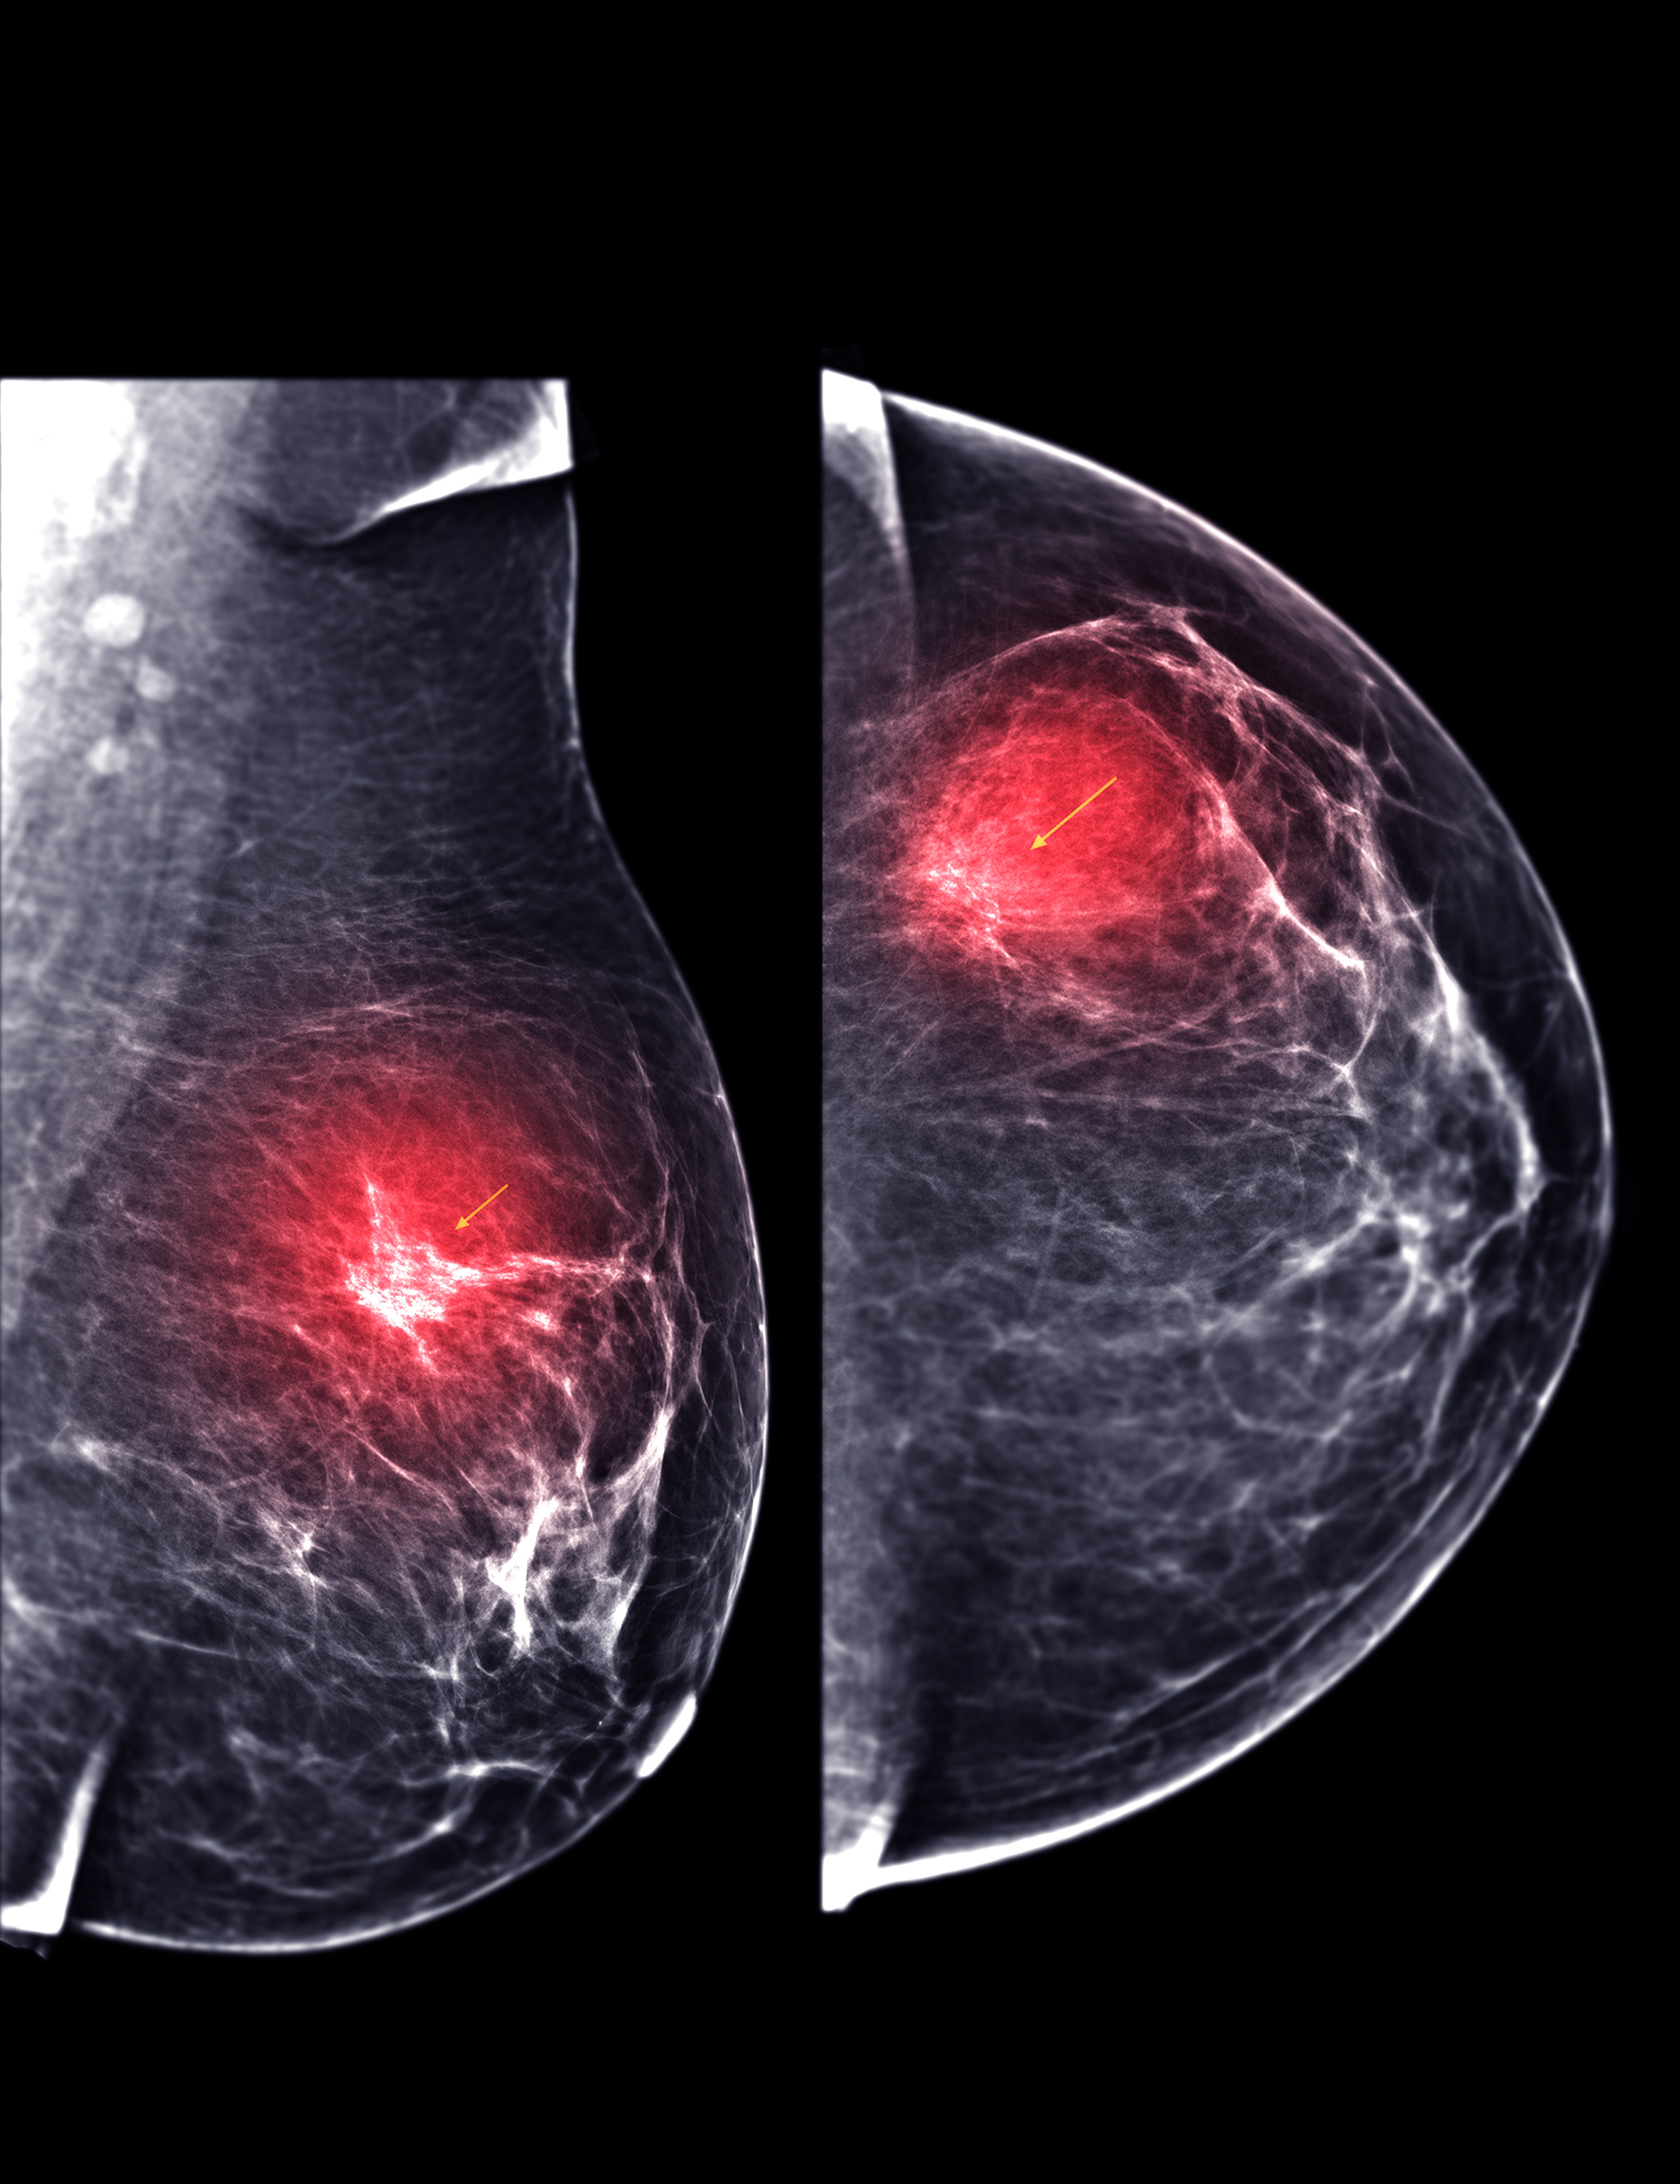
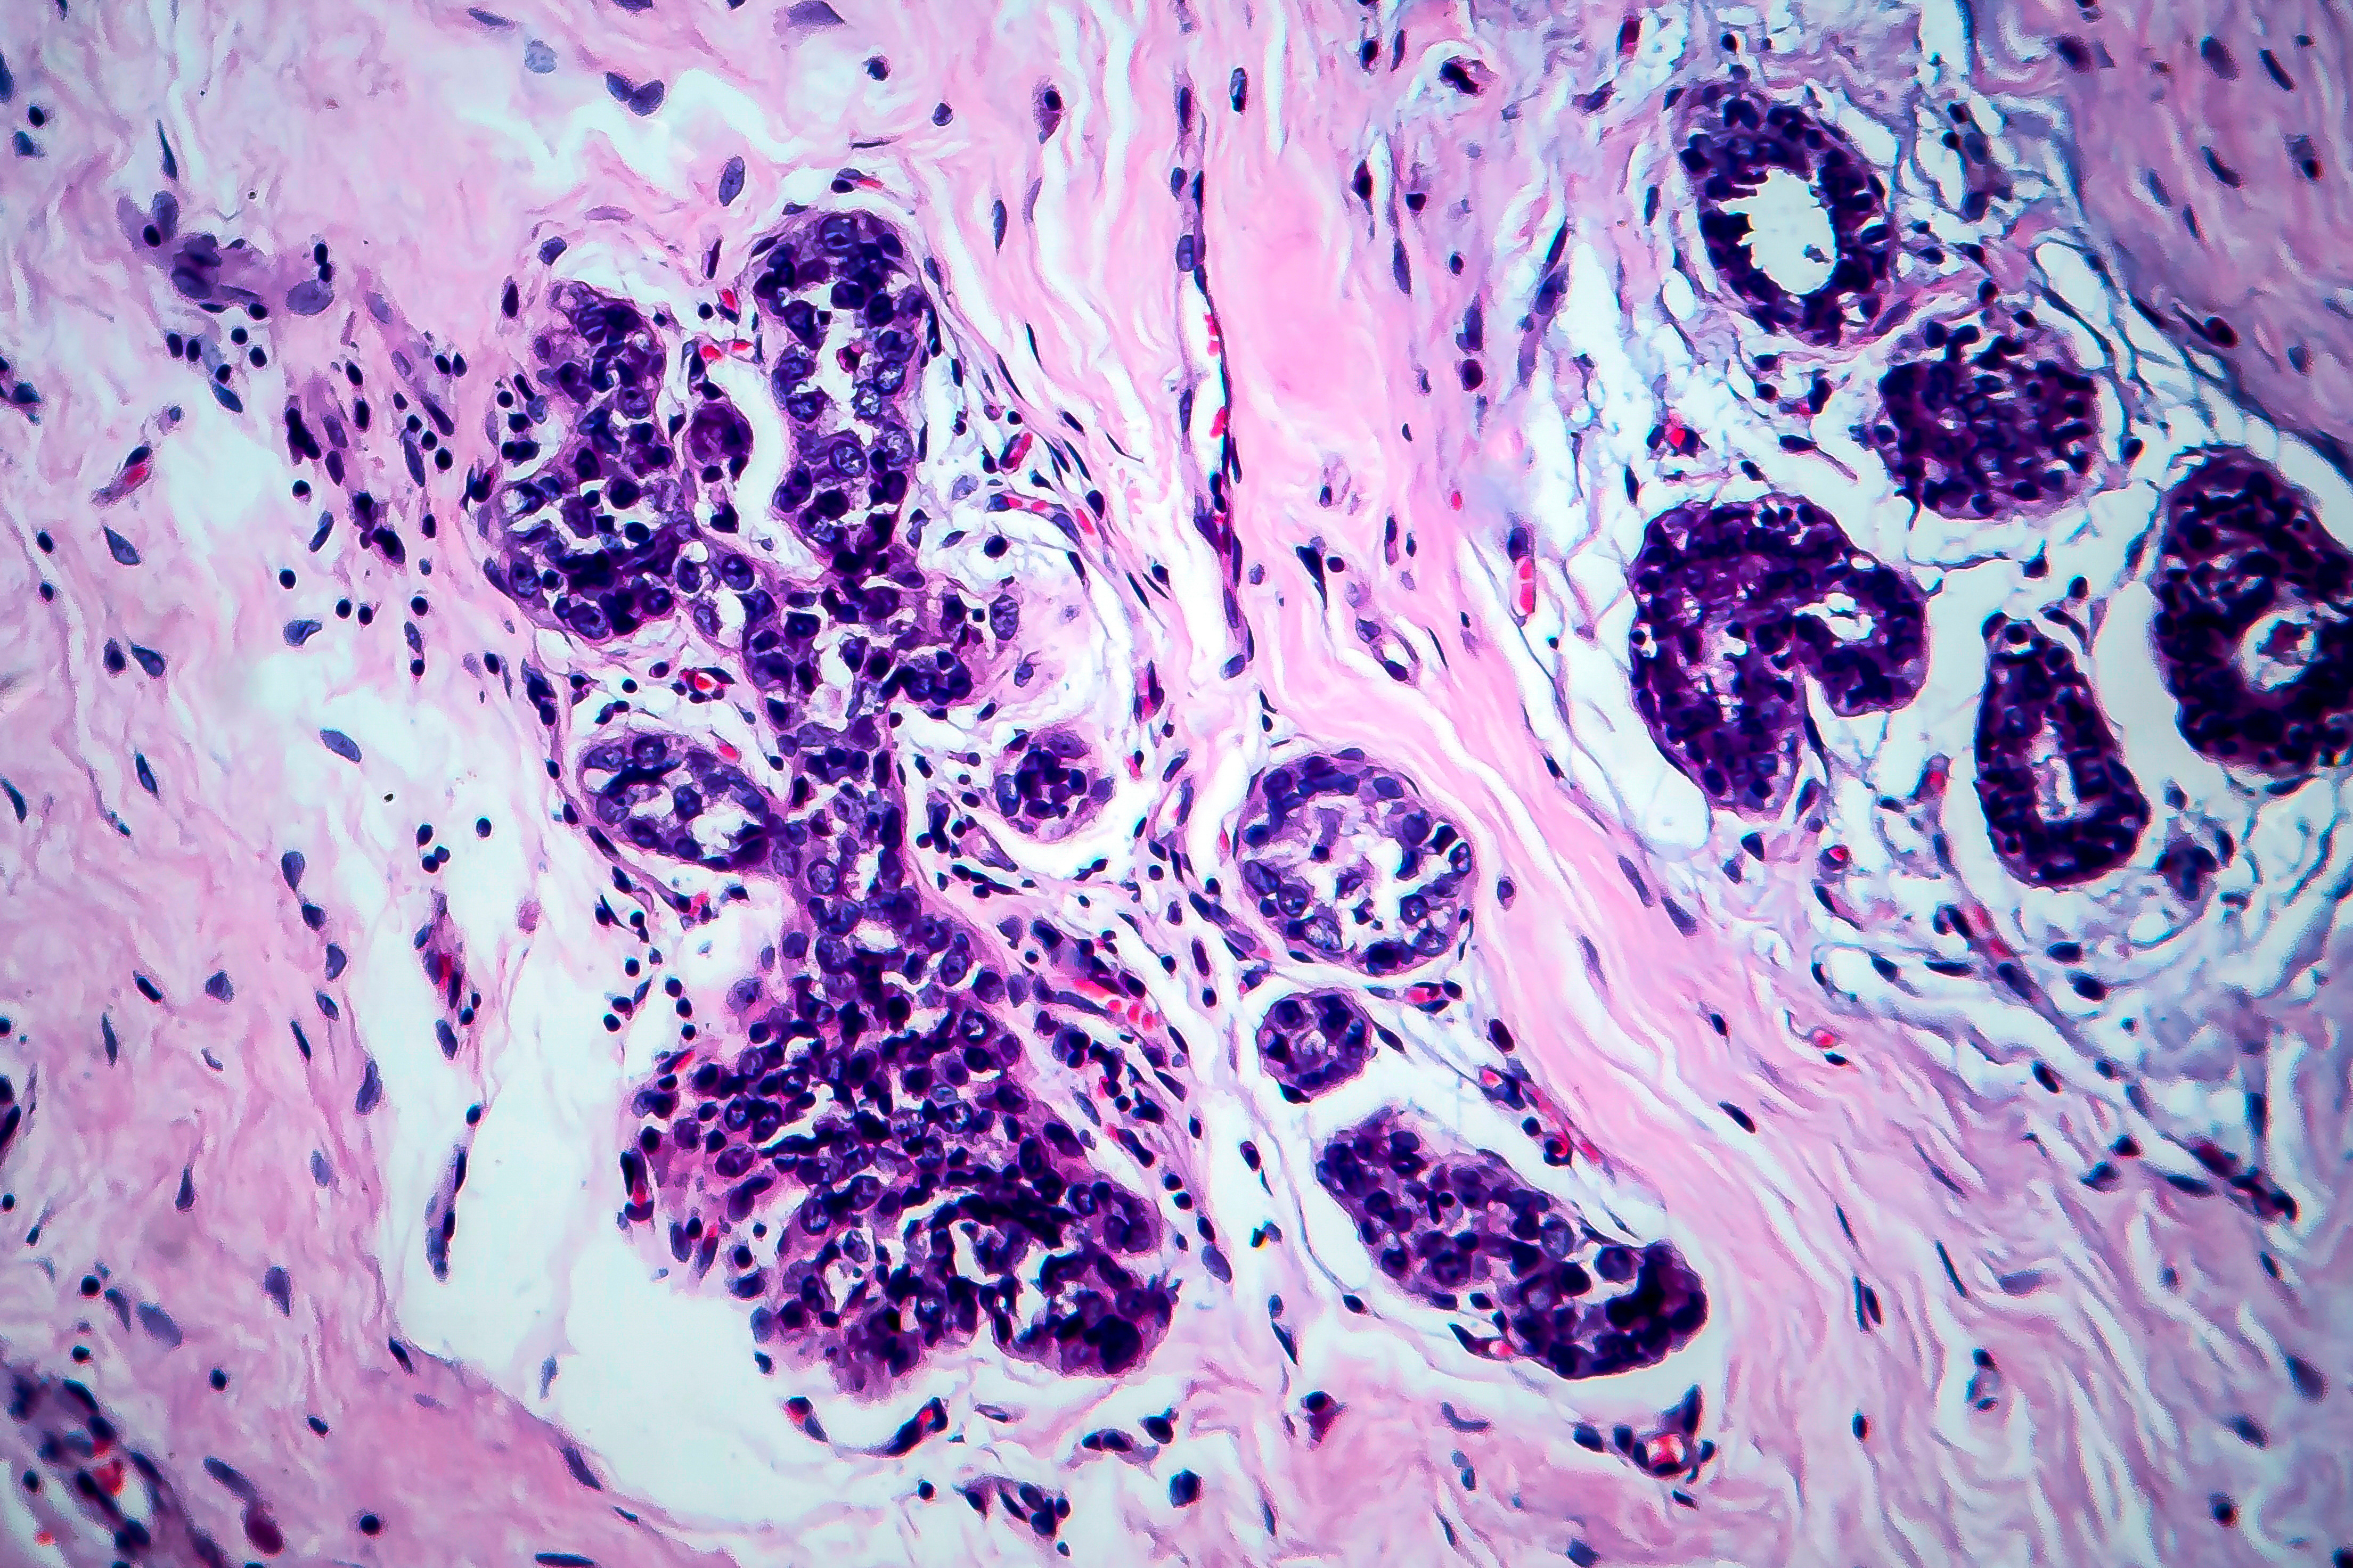
Mammography: Standard diagnostic imaging for breast cancer detection and monitoring
Study Dataset
4,024 patients
3,408 alive (84.7%)
616 dead (15.3%)
Clinical Impact: Without Progesterone Status, the model incorrectly predicts survival outcomes for an additional 246 breast cancer patients out of 4,024. That's roughly 6 extra wrong predictions for every 100 patients we assess.

Progesterone Status

✓ Critical to Keep
When Kept
2,825
correct predictions
(70.2% accuracy)
When Dropped
2,579
correct predictions
(64.1% accuracy)
Impact When Dropped
246
additional patients
misclassified
Clinical Impact: By excluding Regional Node Examined, the model correctly predicts outcomes for an additional 153 patients. That's about 4 more correct predictions per 100 patients. This feature adds noise because the model already includes "Regional Node Positive" which provides better signal.

Regional Node Examined

✗ Better to Drop
When Kept
2,797
correct predictions
(69.5% accuracy)
When Dropped
2,950
correct predictions
(73.3% accuracy)
Impact When Dropped
+153
additional patients
correctly classified

Classification Accuracy by Experiment

Drop-one ablation: each bar = one run. Hover for details. Green = best to drop, Red = best to keep.

↑ higher = better. ↓ lower % when dropped = more important to keep

Best to keep: Progesterone Status (accuracy drops when removed). Best to drop: Regional Node Examined (accuracy improves when removed).

Mammogram highlighting areas of concern in breast tissue
Diagnostic imaging: Identifying suspicious areas requires both visual analysis and biological markers like hormone receptor status

Decision Tree Structure

With Progesterone Status

All 4,024 patients. With Progesterone Status included, the model can split first on hormone receptor status, distinguishing hormone-driven tumors from aggressive ones.
All patients
4,024

Split by Progesterone Status, the ablation study's most important feature. Hormone receptor status reveals tumor biology that node counts alone cannot.

Progesterone positive. Hormone-driven tumors that respond to hormone therapy. 87.6% survival rate in this group.
Progesterone +
3,326

Split by Node Positive ≤ 3. Within hormone-positive patients, how many lymph nodes tested positive further separates outcomes.

Prog+, Node Pos ≤ 3
Hormone-driven tumor with minimal spread, best prognosis group (91.8% survival). 2,083 alive · 186 dead.
Node Pos ≤ 3
2,269
2,083|186
Prog+, Node Pos > 3
Hormone-driven but more nodal spread (78.6% survival). Still benefits from hormone therapy. 831 alive · 226 dead.
Node Pos > 3
1,057
831|226
Progesterone negative, not hormone-driven. More aggressive tumors with only 70.8% survival rate. Cannot benefit from hormone therapy.
Progesterone −
698

Split by Node Positive ≤ 3. For aggressive, hormone-negative tumors, lymph node spread becomes the critical survival factor.

Prog−, Node Pos ≤ 3
Aggressive tumor but limited spread (80.9% survival). Early detection helps. 334 alive · 79 dead.
Node Pos ≤ 3
413
334|79
Prog−, Node Pos > 3
Aggressive tumor with significant spread, worst prognosis group (56.1% survival). 160 alive · 125 dead.
Node Pos > 3
285
160|125
Clinical Outcomes
With Progesterone Status included, the model sees tumor biology first. It separates hormone-driven tumors (87.6% survival) from aggressive ones (70.8% survival) before looking at lymph node counts, creating four distinct risk groups ranging from 91.8% down to 56.1% survival.
Breast cancer cells under microscope showing cellular differentiation
Histological view: Progesterone receptor status reveals cellular differentiation patterns invisible to imaging alone

Without Progesterone Status

All 4,024 patients with Progesterone Status dropped. Without hormone receptor info, the model falls back to lymph node positive count. It can no longer see tumor biology.
All patients
4,024

Split by Node Positive ≤ 8. Without Progesterone, the model's best available split is the raw count of cancer-positive lymph nodes. Accuracy drops to 64.1%.

Node Positive ≤ 8, cancer in 8 or fewer nodes. Most patients land here, but without Progesterone the model can't tell hormone-driven from aggressive tumors within this group.
Node Pos ≤ 8
3,473

Split by Node Positive ≤ 3. Separates minimal spread from moderate, but misses the hormone context that Progesterone provided.

Node Pos ≤ 3
Minimal spread (90.1% survival), but without Progesterone, the model can't separate the 91.8% hormone-positive from the 80.9% hormone-negative patients hidden inside. 2,417 alive · 265 dead.
Node Pos ≤ 3
2,682
2,417|265
Node Pos 4–8
Moderate spread (80.5% survival). Mixes hormone-positive patients (78.6% survival) with hormone-negative ones (56.1%). The model is blind to the difference. 637 alive · 154 dead.
Node Pos 4–8
791
637|154
Node Positive > 8, extensive spread to 9+ lymph nodes. Without Progesterone, the model turns to tumor grade as the next best available differentiator.
Node Pos > 8
551

Split by Grade ≤ 2. Without hormone data, tumor differentiation grade becomes the fallback for separating outcomes in this high-risk group.

Grade ≤ 2, Node Pos > 8
Well/moderately differentiated despite extensive spread (71.9% survival). Without Progesterone, this is the best the model can do to separate outcomes. 235 alive · 92 dead.
Grade ≤ 2
327
235|92
Grade 3, Node Pos > 8
Poorly differentiated + extensive spread, worst prognosis (53.1% survival). Nearly a coin flip. 119 alive · 105 dead.
Grade 3
224
119|105
Warning
Without Progesterone Status, the model is blind to tumor biology. It falls back on lymph node counts and tumor grade, producing a blunter tree that can't distinguish hormone-driven from aggressive tumors. Accuracy drops from 69.9% to 64.1%, the largest decrease of any single feature removed.
Research
With Progesterone, the model sees tumor biology first, separating hormone-driven tumors (91.8% best-case survival) from aggressive ones (56.1% worst-case). Without it, the model is blind to this distinction and falls back on node counts and grade alone, dropping accuracy to 64.1%.

Progesterone Status is the single most critical predictor for patient survival classification.

Regional Node Examined measures how many lymph nodes the surgeon chose to inspect, not how many had cancer. It reflects surgical procedure, not tumor biology.

Removing Regional Node Examined improves accuracy by 3.4%.

Clinical Data
Regional node examination checks the lymph nodes near a tumor for signs of cancer spread. While this helps guide treatment decisions, it does not reliably predict survival because cancer behavior varies widely between patients.

Progesterone status, on the other hand, reveals the tumor's biology and whether it will respond to hormone therapy, making it far more relevant for predicting outcomes.

Sources: Cleveland Clinic · UPMC

Estrogen vs Progesterone

Two hormone receptors, one clear winner in the ablation study

Estrogen molecule structure

Estrogen

93% positive

Progesterone molecule structure

Progesterone

83% positive

Molecular Biology

Both receptors strongly predict survival, but Progesterone won the ablation.

This is due to better data balance. We keep both for clinical completeness but Progesterone's variation allows the model to separate risk better.

Death Rate by Receptor Status

Estrogen 40.1% Negative 13.5% Positive Progesterone 29.1% Negative 12.3% Positive Scale: 0% to 50% death rate

Negative status linked to higher death rates for both receptors

Combined ER/PR Phenotype

ER+/PR+ 12.3% Best ER+/PR- 22.4% ER-/PR+ 22.2% (rare) ER-/PR- 42.1% Worst Scale: 0% to 50% death rate 3,299 patients (P/P) · 456 (P/N) · 27 (N/P) · 242 (N/N)

Best prognosis (12.3%) to worst prognosis (42.1%)

Clinical Inquiry
Important: This is about machine learning, not biology. Both receptors matter clinically—Progesterone just creates better data splits for decision trees.

Why Regression Fails

Three fundamental problems with predicting exact survival months.

Clinical Study

1. Censored Data

Patients still alive at study end: we know "survived ≥X months" but not total lifespan. Regression treats "alive at 60mo" = "died at 60mo"—wrong.

Evaluation

2. Wrong Tool

Survival data needs Cox proportional hazards, Kaplan-Meier, or survival forests. Decision tree regression ignores censoring.

Warning

3. Extreme Variability

Survival ranges 0–100+ months with huge noise. Trees predict region averages—terrible for this data.

↑ higher is better
R²×100 = 3.4
Essentially random
Regression
(R²×100)
Accuracy = 69.9%
Alive vs Dead
Classification
Accuracy = 77.5%
Survive past 2 years?
24-Month
Horizon
Accuracy = 74.8%
Survive past 5 years?
60-Month
Horizon

Regression fails (R² ≈ 3%). Horizon classification achieves 75–77% accuracy by asking "Will the patient survive past X years?"

Why We Don't Include Survival Months

Data leakage happens when a feature contains information that wouldn't be available at prediction time.

Warning

1. Circular Logic

Dead patients have shorter survival by definition. Using survival months to predict alive/dead is like using the answer to predict the answer.

Clinical Diagnosis

2. Not Available at Diagnosis

When seeing a new patient, you don't know how many months they'll survive—that's what you're trying to predict.

Data Protection

3. Real Evidence

Including it gave 83% accuracy (suspiciously high); excluding it drops to ~70%. The higher number is fake—it fails in real-world use.

Rule: Never include variables that reveal the outcome or come from the future. All models here use only diagnosis-time features.

Key Takeaways

Real World Impact

Real World Impact

77% accuracy at 5-year survival classification. This model helps clinicians identify high-risk patients who need aggressive treatment from day one.

Biology Over Anatomy

Biology Over Anatomy

Progesterone Status reveals how the tumor behaves, not just where it spread. Hormone biology predicts survival better than node counts alone.

Machine Learning

Machine Learning ≠ Medicine

Progesterone wins the ablation because of data balance, not clinical superiority. Both receptors matter, but one just splits the data better.

→ View full dashboard with all tables & charts